One drawing. Every answer.
Massive Dynamic turns the wiring diagram of a plant into the commissioning tracker, the schedule, the risk picture and the assistant. Draw it once, and the rest follows from it.
What do you want to do?
Jump straight to the answer
Take the tour
See it in 30 seconds
What Massive Dynamic is
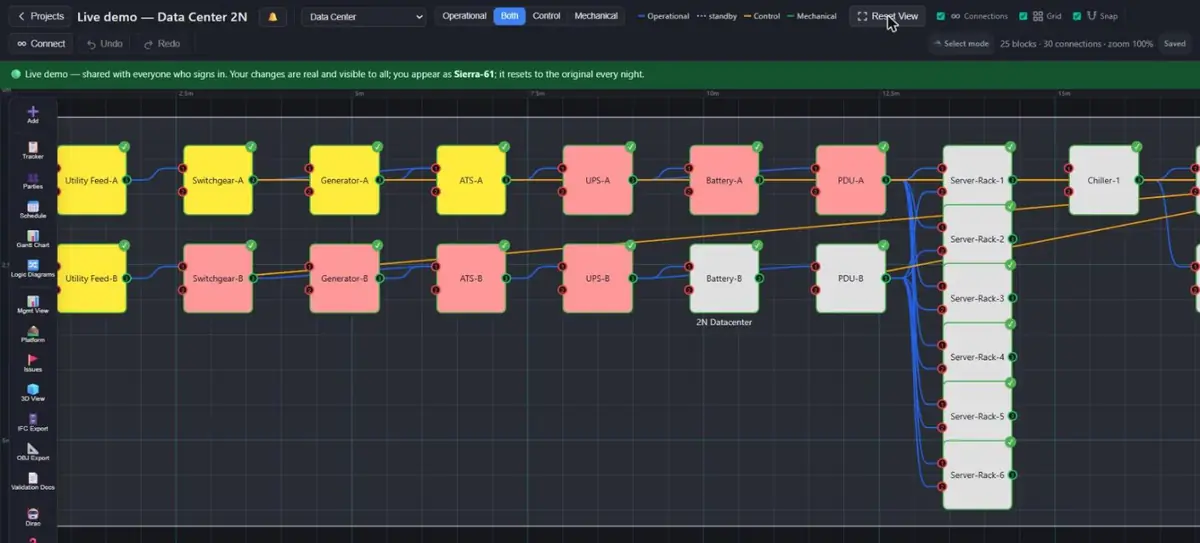
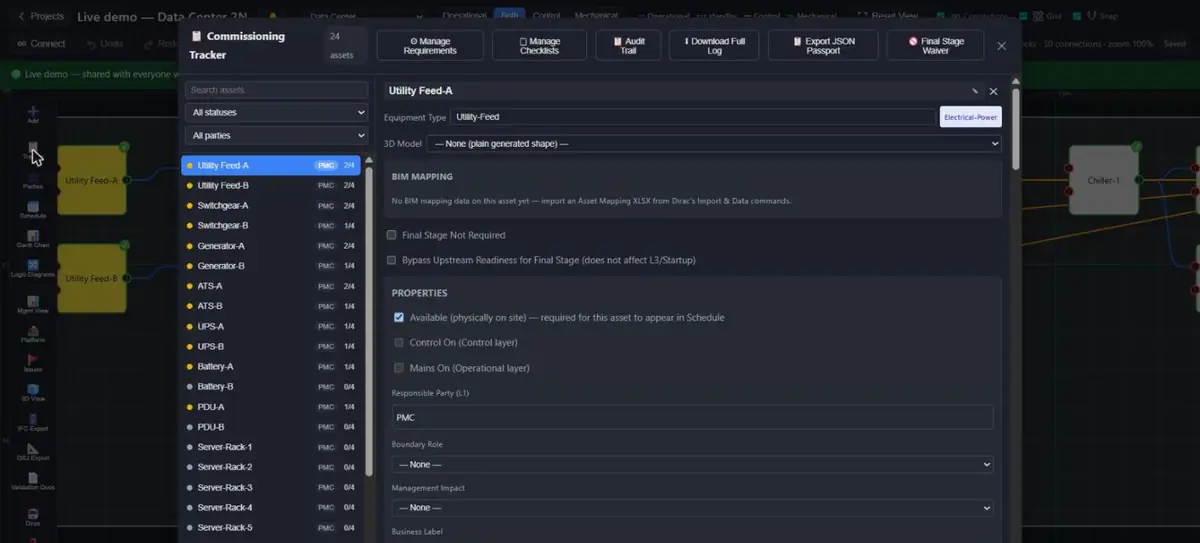
Massive Dynamic is a browser-based commissioning-execution platform for electrical and mechanical infrastructure: data centres, pharma plants, substations and medium/low-voltage distribution. A team draws the facility once, as assets and connections on a canvas, and everything else is derived from that one model: the stage-by-stage commissioning of every asset, checklists and documentation gates, multi-party sign-off, the schedule, the management picture, issues and corrective actions, switching and loss-of-source scenarios, engineering checks, a 3D and VR walkthrough, a phone interface for the field, and an embedded assistant, Dirac, that answers questions and carries out commands against the live project.
The idea behind it: in a commissioning job the plant already knows what depends on what. If the drawing says a board feeds six panels, then the board's energisation gates six sets of tests, the schedule orders them, the management view shows what blocks what, and a scenario shows what happens when the feed is lost. The platform removes the second copy of that knowledge that people otherwise keep in spreadsheets and heads.
Who uses it, and how roles work
Work is split across parties: the commissioning agent (CX), the project-management consultant (PMC), the specialist contractor (SPC) and the owner. Each asset's stages are assigned to a party, and a stage is signed off by the right party. Beyond the party, a member's rights in a project follow a role (viewer, power user, administrator, owner of the project) plus fine controls: which stages they can see, which checklists they may fill, who may raise or close issues. Roles are meant to describe what people do (draw, tick, release, sign) rather than invented job titles, and the audit trail records exactly that.
Typical users: the commissioning engineer on site (phone and tablet), the discipline lead at a desk (canvas, tracker, scheduler), the project manager (Management View), the client's representative (read access, handover package), and the person preparing a design check or a test (engineering and scenarios).
The model: one project, one drawing
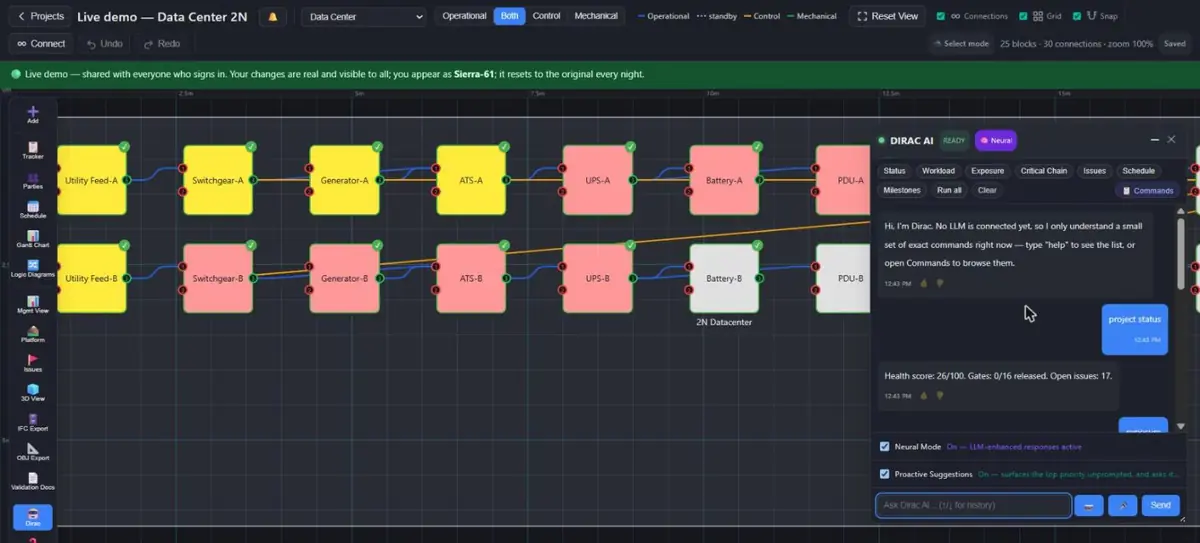
A project holds blocks and connections. Blocks are assets (a piece of equipment with a type, tag, ratings, party and so on), rooms (a footprint that becomes a 3D room and carries the room graph) and package managers (grouping nodes). Connections are directed edges drawn on one of three layers: operational (what carries power or service), control (what signals or interlocks) and mechanical (pipes and ducts). The same canvas serves three project modes: data centre, pharma and substation (the last uses the data-centre stage set), plus a Project Management mode without commissioning layers that renames the layers for planning work.
The equipment library holds 113 equipment types (70 electrical power, 17 pharma process, 16 HVAC, 6 monitoring and control, 3 fire and life safety, 1 generic), each with its own requirements, checklist template, ports, 3D mesh and IFC mapping. Users can add custom types. A project is a single document, saved whole, so every module reads the same truth.
Commissioning: stages, documents, checklists, sign-off
Every asset goes through four stages: L1 Factory Acceptance Testing, L2 Installation and Pre-Start-up, L3 System Start-up, L4 Performance Testing; in pharma mode the same four slots are DQ, IQ, OQ and PQ. Each stage has documentation requirements and a checklist (a library of real starting templates per equipment type that the Checklist Manager can edit; steps can be Pass/Fail/N/A, free text, section headers, or a step that runs an engineering calculation). A stage can be waived project-wide, and counts as satisfied everywhere.
Sign-off is a controlled act: the previous stage must be satisfied, no open critical issue may stand against the asset, the signer must hold the right party and a valid training record, and the signer re-enters their password. Missing documents or an incomplete checklist block the sign-off unless it is forced, and a forced sign-off automatically raises an issue. Tagging checklists let one shared checklist carry the sign-off for a whole group of assets at a stage, to reduce paperwork when a client wants fewer taggable assets. Everything is written to an immutable audit trail.
Scheduling
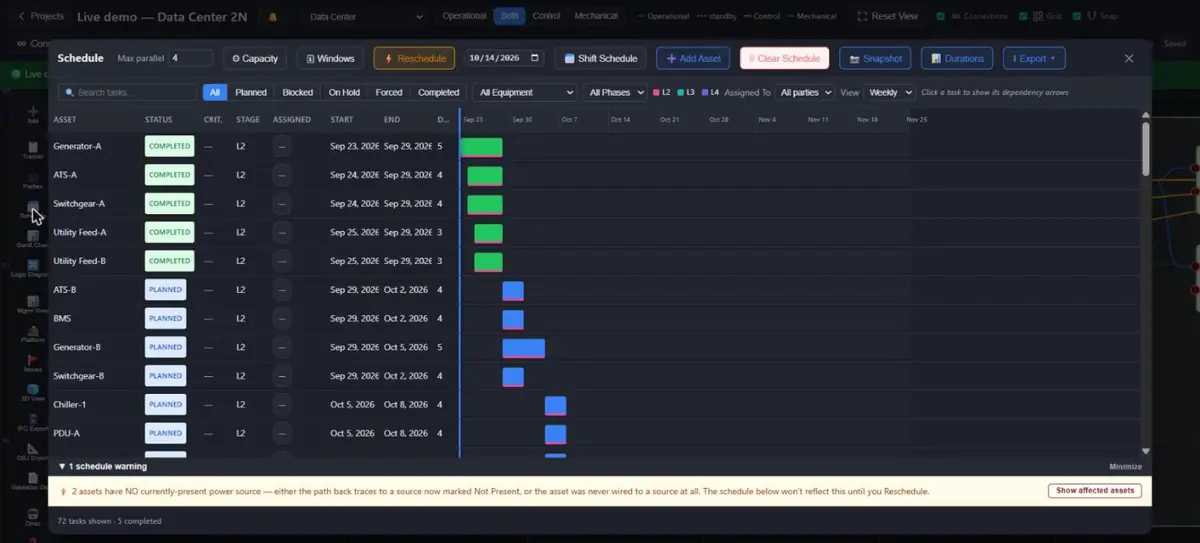
The scheduler builds its tasks from the drawing: one task per asset per stage, ordered by the topology (an asset's stage waits for its feeds), with alternate feeds as OR-groups, working-day durations by type and stage, party capacity limits, an anchor date and a baseline to compare against. It runs in a background worker, learns durations from the corrections you accept (imported or corrected durations apply to later tasks of the same equipment type and stage), can be exported to Word and Excel, and is shown as a Gantt chart and as an animation of the plan played over the canvas (also exportable as a self-contained page). Because the schedule comes from the drawing, a change to the drawing re-plans the job.
Management View
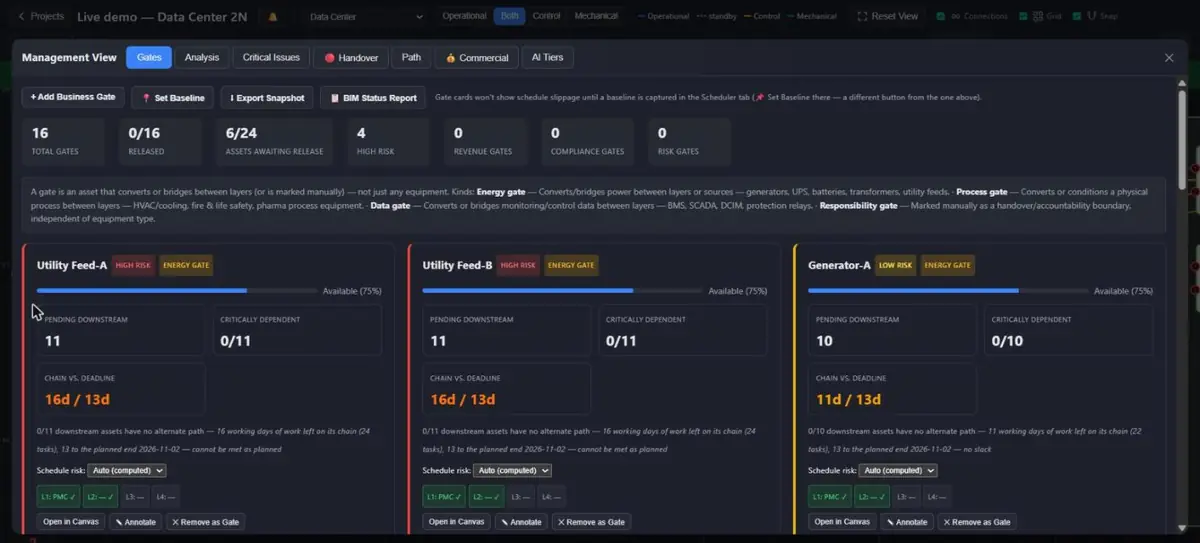
The decision-maker's page, computed from the same model: gates (each asset's release point with a risk rating, escalated by schedule pressure), exposure, a weighted health score with a baseline to compare, the critical chain, held stages, contractor interfaces, scope gaps, workload per party, handover readiness, technical and commercial milestones tied to gates, and a BIM status report that prints. Numbers shown here are produced by single shared functions, so the same figure appears on the desktop, the phone, in VR and in Dirac's answers. Dirac can give the whole picture in one answer ("management summary") and save it as a printable page for a client or a steering meeting.
Issues and corrective actions
The issue register records severity, status, stage, corrective and preventive action fields, photos and assignees, with comments and @mentions that e-mail the people tagged. An issue raised against an asset can block that asset's gate; a project-level issue (no asset) never blocks a gate but can tag assets. Issues can be captured with a photo on the phone, imported from BCF files exchanged with design-coordination tools, and printed as a non-conformance report. Dirac Vision can caption a photo, which is confirmed or corrected by the user.
Switching and loss-of-source scenarios
Because the operational layer is a single-line diagram, the platform can run it: lose a source, open a breaker, fail a breaker to open or to close, start generators, transfer a ring, return to normal. The scenario engine decides what is energised, which transfers close, what stays dark and in what order, with timings (source-loss confirmation, generator start, transfer delay, auto-retransfer) editable per asset and connection. Results are given as a timeline with a legend of the assumptions, and the whole scenario can be exported as a standalone offline page (or a replay of a run) to hand to a client. Scenario mode (an amber button on the canvas toolbar) runs all of this on a private in-memory copy of the project, as designed: every asset counts as installed and commissioned and the plant starts from its normal state, so a plant that is still being drawn can be tested without signing anything off, and nothing is saved. See the Scenario Testing manual.
Engineering calculations
Assets carry nameplate data and connections carry run data (length, cable size and material, parallel cables); with the stated load, Dirac calculates fault level, voltage drop, transformer and board loading (also after losing a source, using the scenario engine), generator step-load acceptance and UPS autonomy, and prepares standalone transformer test calculators (short-circuit test, back-to-back test with line differential). Every answer shows its working, names what it assumed and what is missing. Calculations can sit inside checklist steps so a test record carries its numbers. See the Engineering Calculations manual. Mechanical and pharma-process calculations (pressure cascade, flow balance, utility hold times) are designed but not yet built.
BIM, 3D and VR
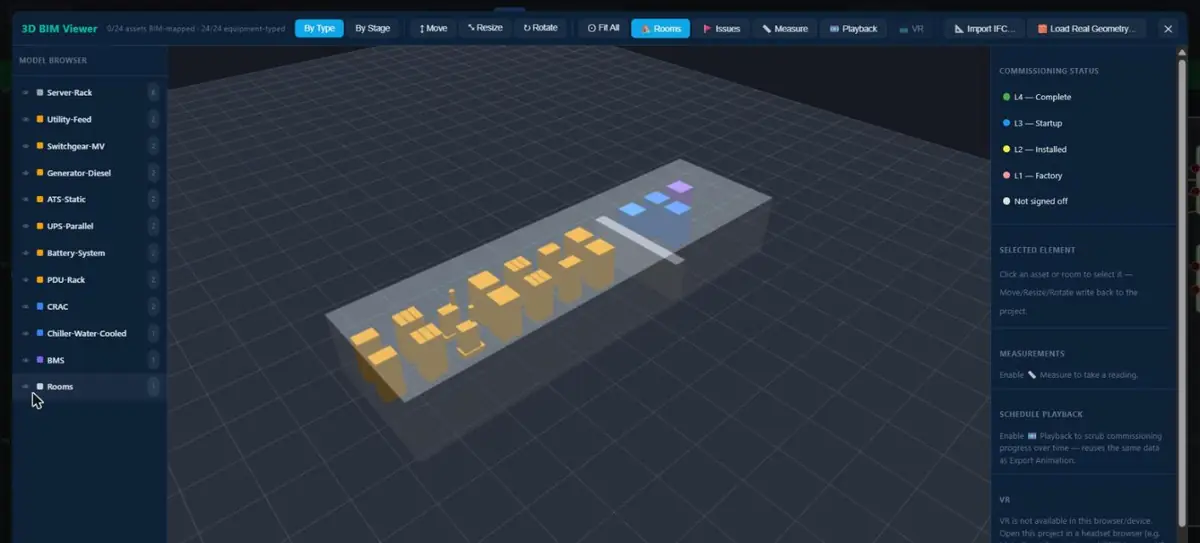
The canvas becomes a 3D scene: rooms, elevated platforms, equipment meshes and, from an imported IFC model, real geometry; state and issues colour the equipment. A VR walkthrough runs in a headset's browser: teleport and walk, a floating menu with the overview and gates, a site board with teleport-to-asset, status badges per asset, a schedule time scrub, issue pages with comments (typed or spoken where the browser supports it) and status changes, all through the same permission checks as the desktop. IFC metadata can be imported to fill COBie-style fields and nameplate values; the project can be exported as IFC, OBJ and a COBie workbook. See the VR Walkthrough manual.
Field use on a phone
Phones and tablets open a separate light interface: project and asset lists, asset detail with stage sign-off, checklist filling, and an issue sheet with camera capture. It works offline: every action is queued on the device and, when the connection returns, replayed onto a fresh copy of the project so the desktop edits made meanwhile survive. A native installable app that opens straight into the 3D viewer is planned.
Data in and out
In: XLSX for assets (including engineering columns), connections, checklist and requirement templates and asset mapping; JSON project files; IFC metadata and geometry; BCF issues; documents and photos into storage. Out: XLSX, Word (schedule, validation DQ/IQ/OQ/PQ reports, reports), the handover package (ZIP), IFC, OBJ, COBie, asset passports, and self-contained HTML pages (scenario simulator and replay, schedule animation, transformer calculators) that can carry a watermark and an expiry when prepared for a recipient.
Collaboration, sharing and access
Several people can work in one project at once. Edits are saved after a short idle time; if two people changed the same project, the app merges their changes by entity rather than asking anyone to reload, and a live presence indicator shows who is in the project. Projects are shared directly with members, whose role and parties decide what they see and do; project groups combine several projects for a read-only overview and allow boundary connections between them, which is how very large facilities are split into linked smaller projects. Accounts are approved by an administrator; the first approval and later role changes follow separate screens. See the Permissions & Sharing manual.
Dirac, the embedded assistant
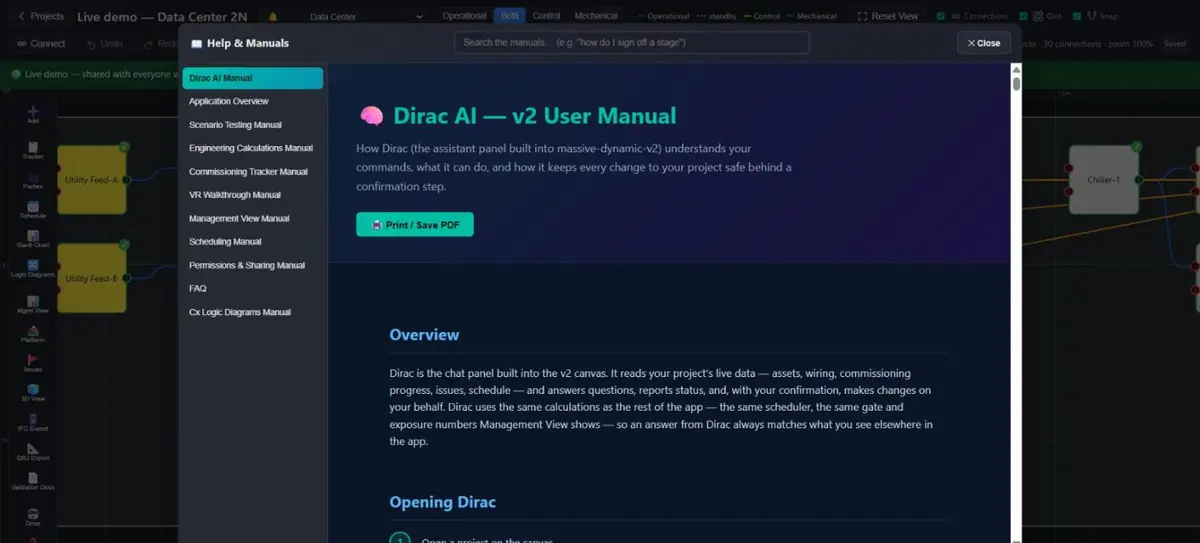
Dirac understands commands and questions about the live project, in layers of increasing cost: deterministic rules (no network), a keyword scorer over the capability registry, optional in-browser semantic matching, and optional language-model tiers for free-form requests (off by default, metered, and never able to change the document without a visible confirmation). The registry holds 96 capabilities in domain providers — switching and scenarios, engineering, commissioning, scheduling, management, topology and general help — each described in one sentence with examples that are tested against the router, and each returning facts as well as text. The manuals are bundled into the app, so "how do I…" is answered offline from the documentation itself. Dirac also teaches itself to see: a vision model captions photos and learns from corrections.
How it is built
A single-page web application (React and TypeScript, built with Vite) served as static files, with Supabase as the only backend: Postgres with row-level security as the authorisation layer, authentication, file storage, realtime presence, and a handful of edge functions that broker calls to the language-model and vision services, so no secret ever reaches the browser. There is no custom application server. The project is stored as one structured document per project, normalised on load so older projects always open in newer builds; a field is never removed, only deprecated. More than 100,000 lines of code sit in 27 feature modules that communicate through shared types and the project document, protected by 1,128 automated tests (pure logic is the tested surface). Heavy parts — the 3D engine, local embeddings, document and spreadsheet libraries — load only when used.
Editions and deployment
Each client gets their own instance: their own database, their own site, their own approved users, cloned from a clean template with a setup script and deployed as a build of the same code. Instances are deployed by the operator, not auto-updated. Planned: per-user licensing by feature (core, scheduler, management, logic diagrams, 3D, VR, mobile, groups, engineering, the Dirac tiers, report exports), enforced by the server and followed by the interface so a tab a user is not licensed for is never fetched; and a no-cloud edition in which Dirac's language model runs on hardware the client controls, with no external AI key in the instance. The deterministic engines (scenarios, calculations, scheduling, management figures) do the same work in both editions; the difference is in free-form conversation and long multi-step planning.
What exists, what is next
| Area | Status |
|---|---|
| Canvas, tracker, scheduler, Management View, issues, groups, permissions | In production use |
| Switching and loss scenarios, standalone simulator export | In production use; edge-case modelling continues from real sequence-of-operation documents |
| Electrical engineering checks and calculators | Built (October 2026); extended with the cable library, transfer-aware loading and checklist steps |
| 3D viewer and VR walkthrough | Built; headset verification and refinements ongoing |
| Phone interface with offline queue | Built; native installable app planned |
| Dirac as a full agent (project digest, sandbox what-ifs, memory, evaluation) | Planned in order after the engineering layer; the capability registry and self-description are done |
| Management View facts for Dirac | Built (October 2026): every management answer carries facts; one management summary and printable page |
| Dirac on organising, scheduling what-ifs and commercial reasoning (logic as business fishbone, party and capacity what-ifs) | Next |
| Mechanical and pharma-process engine (pressure cascade, utility excursions, recovery sequence) | Designed from first principles; needs a schema review with a pharma commissioning engineer |
| Per-user feature licences, no-cloud edition | Planned |
Known limits
The project is one document saved whole, which is simple and robust for the team sizes in use but grows with the project; very large facilities are meant to be split into project groups. Concurrent edits to the very same field resolve in favour of the last writer. There is no feature-level permission yet, so VR or Management cannot be granted separately. Uploaded photos and documents are readable by anyone holding the link, which is fine for current clients and not for regulated tenants. The scenario and calculation engines state their simplifications in every answer and are not a substitute for a protection study or a design review.
Where to read more
 12
12- Search all manuals
- The manuals, one per tab
| Manual | Covers |
|---|---|
| Commissioning Tracker Manual | Canvas, layers, stages, documents, checklists, sign-off, engineering data fields, 3D viewer, exports |
| Dirac AI Manual | Talking to Dirac, every command, tiers, planning interview, vision teaching |
| Scenario Testing Manual | Switching and loss scenarios, timelines, test scripts, the standalone simulator |
| Engineering Calculations Manual | Nameplate and run data, the five calculations, calculator pages, checklist calculation steps |
| Scheduling Manual | Task generation, capacity, baseline, animation |
| Management View Manual | Gates, exposure, health, interfaces, milestones, reports |
| Cx Logic Diagrams Manual | Reading the site as a logic diagram |
| VR Walkthrough Manual | Headset use, menu, board, comments |
| Permissions & Sharing Manual | Roles, sharing, groups, parties |
| FAQ | Short answers to common questions |