Know what blocks handover, before the client asks.
Gates, risk, exposure and handover readiness computed from the same model as everything else, with the schedule pressure of the whole chain built in.
What do you want to do?
Jump straight to the answer
Overview
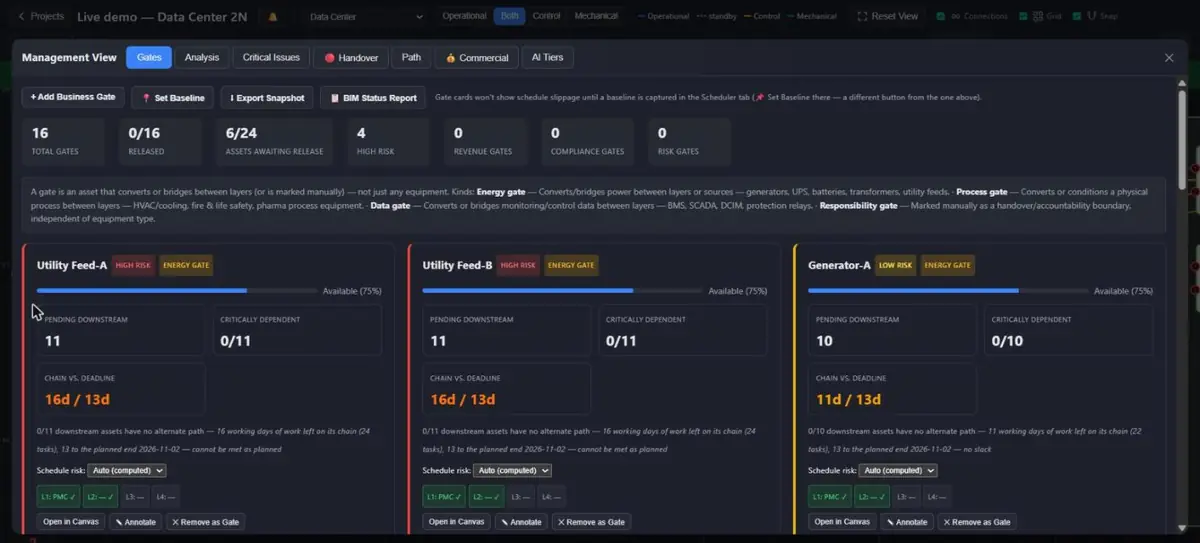 12345
12345- Tabs: Gates, Analysis, Critical Issues, Handover, Path, Commercial, AI Tiers
- Totals: gates, released, assets waiting, high risk
- A gate: risk and kind (energy, process, data or responsibility)
- Chain against deadline: working days of work left against days to the planned end
- Stage chips L1 to L4 with who signed
The Management View reads the exact same project data as the canvas — nothing is re-entered or kept in sync separately. It exists for the audience that cares about business milestones and risk rather than wiring and stage checkboxes.
Opening the Management View
What counts as a "gate"
An asset is a business milestone (a "gate") if it isn't marked Available yet, or if it's explicitly flagged one via a converter role (operational→control or control→operational), a boundary role, or a management-impact tag. An asset's most-advanced state wins when computing its business phase (Pre-Commissioning → Design Signed-off → Build Complete → Ready for Review → Available → Commissioned), including one known quirk: an Available asset with no stage signed off yet still shows "Available," not "Pre-Commissioning."
Stage waivers
Every figure in the Management View now respects the project's stage waivers — the project-wide Not required stages set by an admin, and an asset's own Final Stage Not Required. A waived stage counts as passed: a gate whose L4 is waived is released once L3 is signed off, the health score's stage factors treat the waived stage as done, the Control Layer queue, Workload matrix, Sequence waves, Contractor Interfaces, Scope Gaps and "Same things" all use the same rule, and Dirac's gate answers follow. Before this, a project with L4 waived had every gate stuck at "Ready for Review" and its health score capped, however complete the work was.
Schedule pressure — risk from the whole chain
A gate's risk used to know two things about time: how much work was still open behind it, and whether its own task had slipped against the Scheduler baseline. It never asked whether there was still time to do everything that has to happen before it. Now each unreleased gate shows Chain vs. deadline: the working days of work still standing on its whole predecessor chain (the longest path of unfinished task durations up to the gate's release stage, live sign-offs and waivers applied; an OR-group counts as its cheapest member) against the working days left to its deadline — the asset's target date if it has one, else the Scheduler baseline end of that task, else the plan's own projected end. The card says "cannot be met as planned" when the chain does not fit, "no slack" when more than 80 % of the remaining time is already spoken for, and "past" when the deadline has gone by with work left.
This escalates the gate's severity and never lowers it: no slack → one tier up; cannot be met → at least high; deadline past with work left → critical. It needs a schedule: run Reschedule in the Scheduler so the snapshot exists, set a 📌 Baseline when the plan is agreed, and give the gates that carry a commitment a target date on the canvas — that is the deadline the pressure is measured against.
Gates tab
One card per gate, with a summary bar (total/released, assets awaiting release, high-risk, revenue/compliance/risk gate counts, and — when any exist — a "Not Present" count) across the top, plus a legend explaining the 4 gate kinds (see below). Each card shows business phase, a boundary-role badge (Energy/Process/Data/Responsibility gate, with a description on hover), an impact badge, a 💰 commercial badge when the gate has at least one commercial milestone, downstream exposure, an automatically estimated risk level (manually overridable), current status, per-stage (L1-L4) responsible-party chips, and whether the asset is physically NOT PRESENT yet.
A top action bar lets you add a manual business gate, set a baseline snapshot, export a point-in-time snapshot (XLSX), open a 📋 BIM Status Report, and annotate any gate with a custom label, boundary role, or risk override.
Unavailable connections
Any connection can be flagged Not Available (broken, or not yet physically terminated) from its own info panel on the canvas — it then renders dashed on canvas, and every unavailable connection project-wide is listed in a dedicated "Unavailable Connections" section of the Gates tab, by its two endpoint asset names and layer. This is purely informational: unlike a Room checklist or an Asset's own stage gates, an unavailable connection never blocks sign-off on the asset it feeds, and it is entirely independent of any Issue you separately raise about that connection — toggling one never changes the other.
Analysis tab
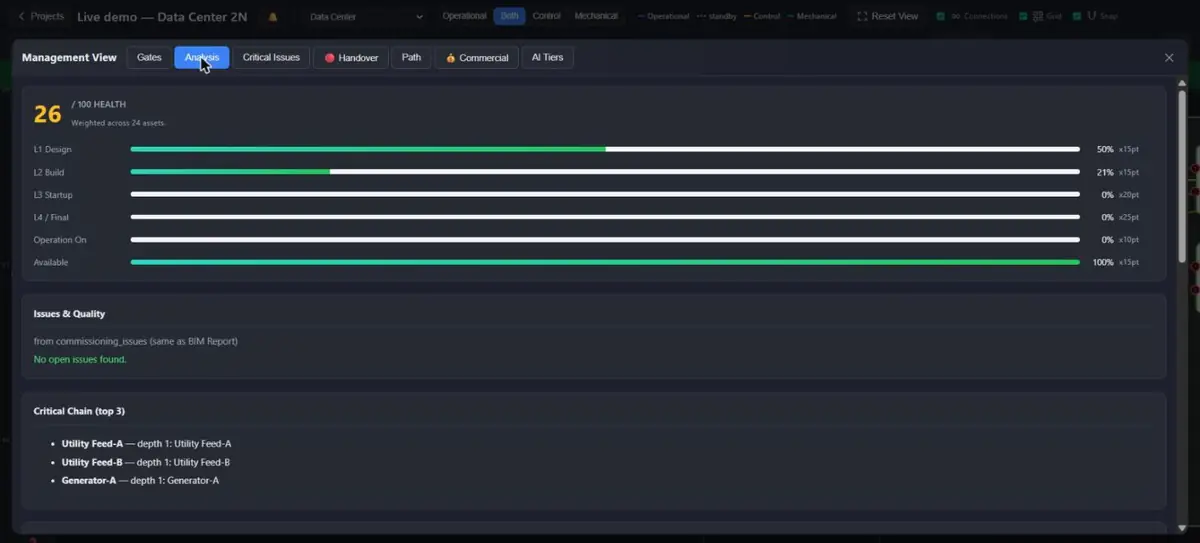 123
123- Health score out of 100, weighted across all assets
- Each factor with its weight in points
- Critical chain: the longest blocking paths
Brings together a project health score based on live Operation-On status, issues & quality by party, the critical chain for each unreleased gate traced to its root cause, a workload heat-map by party and stage (including package-manager block contributions), and a "not present yet" banner for assets that haven't arrived on site.
Critical Issues tab
Every asset carrying at least one open critical-severity issue, uncapped and sorted most-affected first — a standalone tab rather than folded into Analysis's severity-weighted list, so a single critical issue can never get crowded out behind several lower-severity ones.
Handover tab
A red/amber/green readiness board for project handover, computed from the same data the other tabs already use — gate release status, open issues (critical issues and raised NCRs weigh heaviest), and checklist/documentation completion percentages. Nothing is re-entered: if the Gates and Issues pictures are healthy, Handover goes green on its own. The gate count is the same one the Gates tab shows: a gate whose asset is not yet on site counts as unreleased (it cannot be released before it arrives), and the caption says how many are in that state — "0 / 24 gates released (24 not yet on site)" is a red board, not an almost-ready one.
An Export Handover Package action bundles the deliverables a client actually receives at handover — the JSON Commissioning Passport, the BIM Status Report (XLSX), and one Non-Conformity Report per NCR-raised issue — into a single downloadable zip.
Management summary
Ask Dirac for the management summary (or "weekly report", "steering update", "executive overview") and the whole picture comes back in one answer instead of six: health score and handover readiness, gates released against the total, how the unreleased gates stand against their deadlines (overdue, cannot make it, tight, on track), the longest blocking chain, the milestones not yet met and what each is waiting on, the commercial position (not invoiced, invoiced, paid, and any item whose date has passed without an invoice), open issues by severity, the parties with the most pending work, and the change since the baseline if one was set. Nothing is calculated separately for the summary: it is the same gate, exposure, handover, milestone, commercial and workload figures the tabs above show, collected into one small record, so the chat and the screen cannot disagree.
Add "as a page" (or "to print", "to download") and the same summary is also saved as a self-contained page that prints to A4 portrait: headline figures, the baseline comparison, the top unreleased gates with their risk, deadline verdict, remaining chain days, days to the deadline, slippage and open issues, what is holding the top gates, the unmet milestones, the commercial table and the workload by party. It is meant for a client or a steering meeting; open it in a browser and print or save as PDF. The same record is also given to the language-model tiers (when switched on), so a free-form question such as "which milestone is most at risk" is answered from these figures rather than from guesswork. Lists are cut to the first few entries (eight gates, three chains, eight milestones, six commercial items); the page says how many more there are.
Path tab
A real, rendered SVG graph of the project's cross-layer dependency path — not a text summary. Search for an asset by name, pick it from the match list, and its full multi-branch upstream/downstream graph renders at normal scale (level-based layout, arrowed edges colored by layer, per-asset L1-L4 stage chips). The layer color convention matches the canvas: operational = blue, control = amber, mechanical = green, with a matching legend shown next to the canvas layer-visibility toggles. A 🖨 Print / Save PDF button opens the graph in a new window for printing — there is no separate PNG or CSV export.
Commercial tab
Commercial tracking is a third, fully independent dimension. Milestones track only a status — Not Invoiced / Invoiced / Paid — with the date each transition happened. There is no monetary amount tracked, and this tracking is independent of the operational/control energization system: a milestone can be marked Paid on a gate that's still fully unreleased, and vice versa.
When creating a milestone, pick one of three anchors — what determines the milestone's target date:
- A single asset (gate) — the original mode. Anchors to one gate; a target date can be left unset, picked manually, or derived live from that gate's own scheduled end-of-stage date.
- A group… — anchors to a Scheduler joint-test group (new ones can be created right from this tab, or an existing Scheduler group can be picked). Use this when the commercial event genuinely depends on several assets being tested TOGETHER as one synchronized event — the group's members all share the same target stage(s), matching how the Scheduler itself treats them.
- Per-asset targets… — for when several assets belong to one commercial milestone but each has its OWN, independent target stage (for example: this milestone isn't complete until Asset A reaches L2 and Asset B separately reaches L3). Check each asset on the left and pick its stage on the right ("Joint all per stage" sets one stage on every currently-checked asset at once, a shortcut when most members share the same target). The milestone's target date is fully derived — the LATEST of every checked asset's own resolved stage date — and isn't shown until every member has a scheduled date for its own target stage.
Use "A group…" when the assets are physically tested together as one event; use "Per-asset targets…" when they're commercially bundled but scheduled independently. A gate-anchored or per-asset-targets milestone can be edited after creation (label, target date/stage); the anchor itself is set at creation and isn't changed later.
A small 💰 badge appears on a gate's card in the Gates tab whenever it has at least one commercial milestone anchored to that gate directly, so the two tabs stay visually linked without being functionally coupled. Group- and per-asset-targets-anchored milestones don't attach to any single gate's card — they appear only in the Commercial tab's own list.
AI Tiers tab
Per-project toggles for T0, T0.5, Tier 1, Tier 2, and Tier 3 — see the Dirac AI Manual for what each controls. Tier 2 uses a local semantic-similarity model.
Notifications
released column. The notification reads "Gate Released: {name} — {Revenue/Compliance/Risk Gate or Hold Point}", using each gate's own impact tag; the exact wording can vary slightly by project type. Click a notification to jump straight into this panel. Notifications are in-app only (there is no browser/OS push), so they only fire while the app tab is open. They are stored per-browser and are not synced across devices.Business annotations
Gate cards can be manually annotated (custom label, risk override) directly in the Gates tab. Note that "Owner" in this business-annotation sense (a party role like Facility Owner/Client) is unrelated to the account-level "owner" tier that gates the AI Tiers tab — see the Dirac AI Manual's permissions note for the same distinction.
Project Groups & Cross-Project Cascade
A Group ties several related projects together (e.g. every room of one facility build) under Project Manager. Every group member can see a read-only Group Combined View — Gates/Analysis/Critical Issues side-by-side per project in the group — while each project's own edit permissions stay exactly as they were; joining a group never upgrades what you can change in a project you're only a viewer on.
Inside the Group Combined View, you can draw boundary connections — the real link between one project's asset and another's, e.g. a WFI Generation Room project's WFI-System feeding a Sterile Filling Suite project's CIP-Skid. Once at least one boundary connection exists, a "Run Cross-Project Scenario" action simulates turning that feed on or off and reports what changes across every project the group touches — not just the one open on your canvas. The same scenario can also be run from Dirac chat (see the Dirac AI Manual), and both ways of running it produce identical results.
In the VR walkthrough
The 3D BIM Viewer's VR mode (see the VR Walkthrough manual) carries a Management menu in the headset, on six pages (read-only except the Issues page, where an issue can be commented on and its status changed): an Overview (health score, gates released, assets awaiting release, high-risk and critical gates, assets by stage, handover readiness with open critical/high issues and checklist/documentation completion, the unreleased gates highest-risk first), Gates (every gate with kind, impact, phase, downstream reach and sole-path dependents), Milestones (defined milestones with live requirement progress and blockers, plus Dirac's suggested milestones), Commercial (status, target date, days remaining/overdue per commercial milestone), Issues (the whole project's issue list — Open / All, filterable to project-level issues or to the selected asset — each row opening the issue's detail, photos and comments), and BIM Report (the same cards and per-asset rows as the BIM Status Report button above — total/accepted/awaiting/open-issues counts, plus each asset's stage, availability, next outstanding stage completion, and open issues). Every figure is produced by the same computations as the tabs above — it is a view of this data, not a second copy — so a manager can walk the site in a headset and read the same picture the office sees here. The same menu can be previewed on the desktop from the 3D viewer's VR section without a headset.
FAQ
Why didn't a gate get flagged automatically for an obvious business milestone?
Massive Dynamic does infer gate membership from equipment type for the obvious cases (a generator, UPS, BMS, SCADA, chiller, etc. is auto-detected as a gate even with nothing set on it) — see the gate-kind legend. If an asset still isn't showing up, set the converter role, boundary role, or management-impact flag on it directly, or leave it unflagged (it's still a gate as long as it isn't marked Available).
Why is there no way to get an alert when a gate releases?
There is — see Notifications above. It's in-app only (no browser/OS push, stored per-browser) rather than a background alert, but it does fire automatically the moment a gate energises, no manual checking required.